RMG Magazine Index
A complete reference chart
The spreadsheet “RMG Index xx” is a comprehensive search tool for the entire history of RMG back issue magazines**. It contains a chronological list of articles published throughout the entire history of the Guild from the first Newsletter dated October 1986 to the latest issue, currently volume 111 Spring 2023. The file name shows which magazine issues are covered, currently, “RMG Index 100” meaning “up to issue 100”.
The work will be regularly updated as new volumes appear, and/or improved from time to time as the project develops. If new ideas or suggestions are provided, or if any typing or referencing errors are highlighted, I can incorporate the corrections and include any or all potential improvements, such as adding new tabs with more information on the various topics for example.
This really is a “work in progress”!
**Note that not all historical volumes are currently available, however we do have an on-going project to rectify this and I hope to continue this in the not too distant future.
The spreadsheet is free to download by clicking here after which you can alter or amend it to suit your own needs.
Instructions/Guidelines
To open the spreadsheet, you will need Microsoft Excel 97 or later, or other spreadsheet software that will open Microsoft Excel (.xls) files. You can view the file on a smartphone or tablet, but you may not have the filtering options available. To enable this feature, convert it into an excel file on your device.
At first glance, the spreadsheet looks a little bit daunting, but by using the filtering options at the top of each column, you can narrow down your search very quickly and easily, using a wide range of search criteria, to find a general topic or any specific item that you wish ….. or, you can just browse through the entire listing at your leisure.
Hopefully these guidelines (which assume no previous experience of spreadsheets) will help to de-mystify the logic and assist you in deciphering the information to quickly find what you're looking for.
Categorising articles and models into specific genres was a little less straightforward than I’d bargained for because there is often an overlap of different categories or a combination/choice of two or more.
As a result, the chart includes several branches of categorisation to allow these blends and options to be considered.
Consequently, there is I am sure, a whole host of anomalies and mistakes to be found even though I have checked through it many times during compilation, and continue to do so.
If you do find any omissions or errors that you feel need to be corrected, please e-mail me with the details and I'll take a look and reply either with an updated version or reasons for retaining the current data.
All constructive criticism and helpful suggestions will be warmly received.
Information Layout
Much of this is fairly self explanatory but I’ll cover all aspects of the chart anyway.
To begin with, there are two tabs labelled at the bottom, “Index 1-88” and “Article Categories”. (Figure 1)
These should be self explanatory:
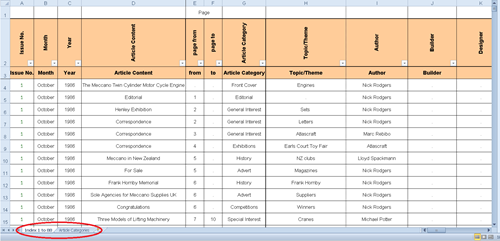 fig 1
fig 1
To open either, just click on the tab label. A few more tabs may be added later on.
Looking at the main Index tab, and working across the top, you will see all the column titles. They may not all appear on screen, so scroll across using the horizontal scroll bar, to see the rest. (Figure 2)
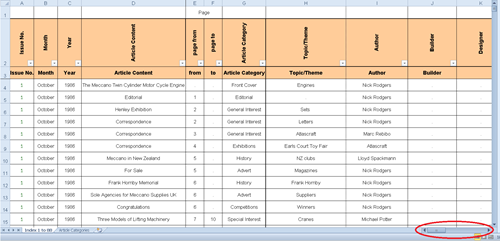 fig 2
fig 2
The column titles are ‘frozen’ so they should remain visible with the filter buttons at the top of your screen, even as you scroll down through the rest of the chart.
Column titles are as follows:
- Issue No. — self explanatory
- Month and Year — self explanatory
- Article Content — the title of each article as it appears in the magazine
- Page From and To — self explanatory
(note that page numbers for each issue up to volume 34 followed on sequentially. By this time it became painfully clear that the numbers were getting too large. The editor then reverted to numbering pages from 1 to 60 (or there-about) for each issue.
-
Article Category — this is the first level of categorising and applies to all articles. For example, exhibitions, meetings, history, members, models etc.
- Topic/Theme — the next level to search, for example, if you’re looking for exhibitions or meetings, where are they located. You might be looking for a genre of models, or a particular one built by a particular person. Start here — it might be vehicles, clocks, or Meccanographs etc.
- Author — who wrote the article (as far as I’m aware)
- Builder — who built the model (specifically featured in the article) (as far as I’m aware)
- Designer — who originally designed the model (as far as I’m aware)
- Other Credits — anyone else involved in the design or build project
The next group of columns highlighted in blue (Figure 3) relate specifically to featured models, and helps to fit them into one or more various categories:
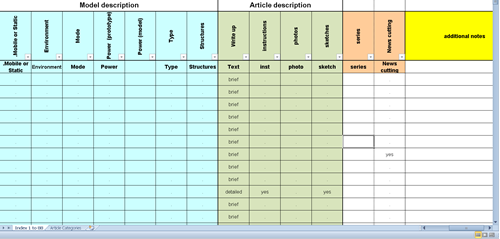 fig 3
fig 3
- Mobile or Static — seems obvious at first, but look again! A bridge would be static. A car chassis might be mobile if it actually moves along, or it might also be classed as static if it’s mounted on a stand or turntable? So either mobile or static could apply, possibly both. Tricky!
- Environment — where would the prototype operate — air, land, sea, space, or a combination of these?
- Mode — What about land for example — is it for road, or rails, or all-terrain? Is it wheeled, tracked or walking?
- Power — how is the prototype driven? Wind, water, steam, petrol, electric?
- Power — how is the model driven? Hand powered, clockwork, electric* motor? (* This will later be expanded to include Direct Mains, Transformer, Battery, voltage required)
- Type — e.g. a road vehicle could be a car, truck, bus, bike etc, etc.
- Structures — static models could be bridges, buildings, monuments, static cranes etc.
The next group of columns highlighted in green (Figure 3) relates to the nature of the written article:
- Write Up — brief description or detailed explanation?
- Instructions — is the construction of the model described in detail?
- Photos and Sketches — are these included or not?
- Series — is the article one of a series or parts?
- News Cutting — is the article taken directly from a newspaper item?
Filtering
Each column has a filter button at the top. (Figure 4) You can use these to narrow your search for one column, and then continue to narrow it further from any other column/s.
To begin with, these all appear like the one circled green (not active) and the entire chart is on view.
A filtered column appears like the one circled red (active).
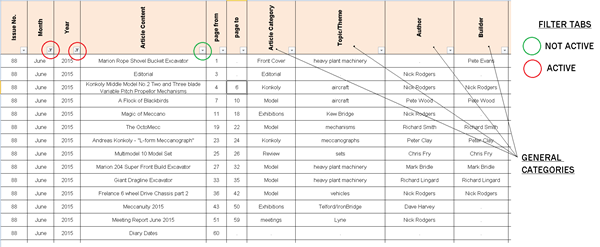 fig 4
fig 4
When you click on the filter button, (Figure 5) a drop-down menu appears listing the items included in that column which you can filter out. You can either:
- Un-tick the boxes of the items you don’t want to see, then click “OK”, or
- Un-tick “select all”, then tick the items you do want to see, then click “OK”, or
- Type in your search criteria in the text bar provided.
All un-ticked items will then be hidden (including the entire row they sit in), so the chart becomes much smaller and more manageable.
I suggest you don’t hide the titles (as these are included in the drop down list) but it’s not the end of the world if you do.
Bear in mind that having filtered one column, the menu choices in the other columns’ filters may be reduced temporarily.
Undo filtering for any or all columns by ticking “select all” to re-gain the full menu range in each one.
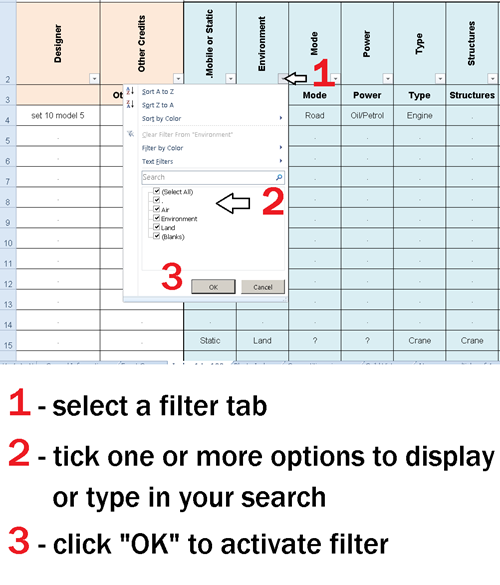 fig 5
fig 5
The best way to get to grips with this is to just have a play and experiment. If it all goes horribly wrong, just close the application without saving it, and then start again.
As a last resort, you can always just download the original version again!
Any questions or difficulties, please feel free to contact me for answers.
Note — I am not an expert in Excel by any means and my knowledge on the subject is pretty limited! There is probably far more we could do with this project, and I am always open to education and suggestions.
Happy exploring!